Like any code based platform, there are times when developers will need to debug their code in order to test the functionality of a custom Bric. Blocs and its API are designed with the aim of making the process of debugging 3rd party code as streamlined and efficient as possible.
The Debug Console.
Blocs has a built in developer console that makes it easy to log and debug the issues a developer may encounter when creating a custom Bric for Blocs. The developer console can be accessed via the main menu Developer > Developer Console. To post a debug log to the console, use the debug API call.
Developer Mode.
Blocs comes with a built in developer mode that can be enabled via the main Blocs preferences (main menu Blocs > Preferences). Enabling this option will prevent runtime cache, meaning any changes made to javascript functions in a custom Bric (while the Blocs application is running), will be loaded into the design environment in real-time. This helps to debug and try out a custom Brics functionality without the need to restart the Blocs application.
Reset Bric State.
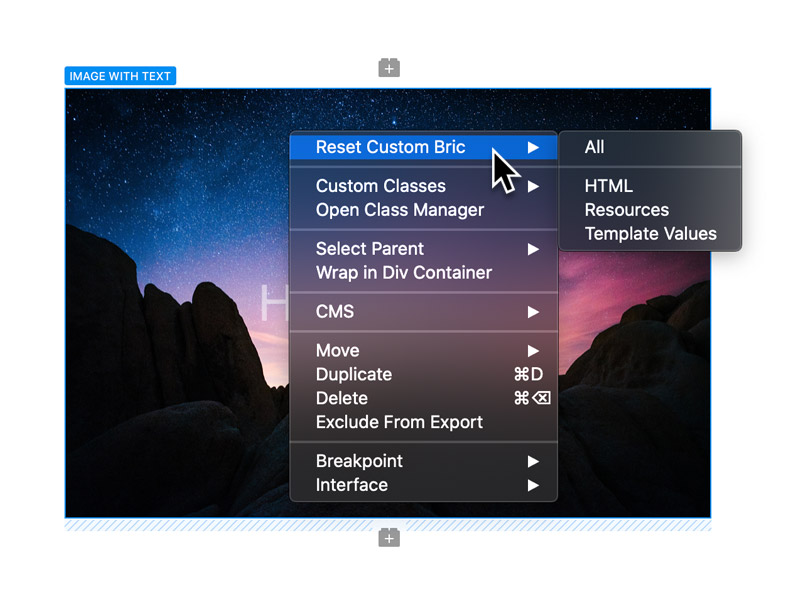
Blocs has a built in feature that lets developers quickly reset various aspects of a custom Bric. It’s possible to fully reset a Bric back to its initial (add to page) state, or alternatively just reset individual aspects of a custom Bric such as the HTML, resources or template values. These options are useful if a developer makes changes to the content of a Bric as it will flush the old data from a Bric that is stored in a project and will replace it with the latest version of the Brics default data.
These reset options can be accessed by right clicking any custom Bric and selecting Reset Custom Bric from the custom Brics contextual menu.